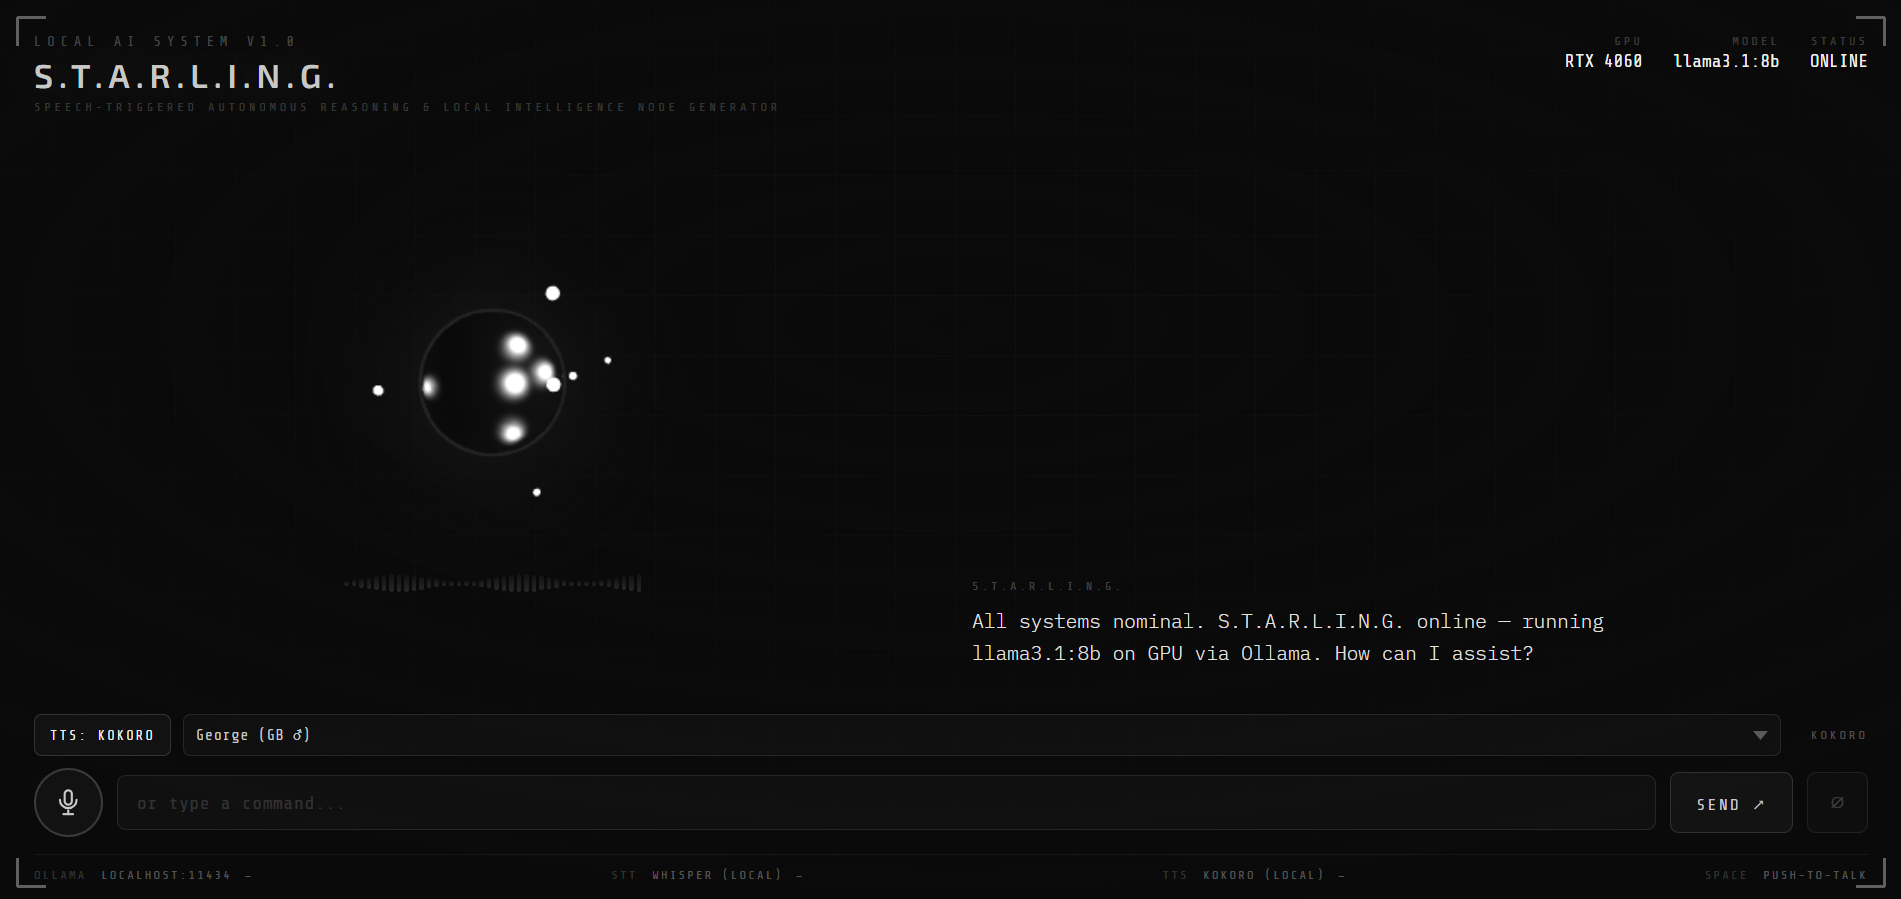
STARLING — Local LLM Voice Interface
Voice-driven local LLM interface via Ollama — Whisper STT, Kokoro TTS, streaming responses, and an animated HUD. No cloud APIs.
Voice-driven local LLM interface via Ollama — Whisper STT, Kokoro TTS, streaming responses, and an animated HUD. No cloud APIs.

An interactive web dashboard for music leagues built with vanilla JS, D3.js, and Chart.js. Features leaderboard, song stats, fan map, trend analysis, economy breakdowns, comments, and headlines — all from CSV files, no backend required.

A fully local, open-source robot built in progressive phases — from a conversational LLM (Phi-4-mini via Ollama) through RAG memory, voice I/O, computer vision (YOLOv8), and face recognition, to a self-contained physical robot on a Raspberry Pi 5. No cloud APIs.

A locally-run AI Dungeon Master powered by Ollama that guides players through D&D 5e adventures — with persistent memory via a knowledge graph, a seeded dice engine, and spoiler protection. No cloud APIs.
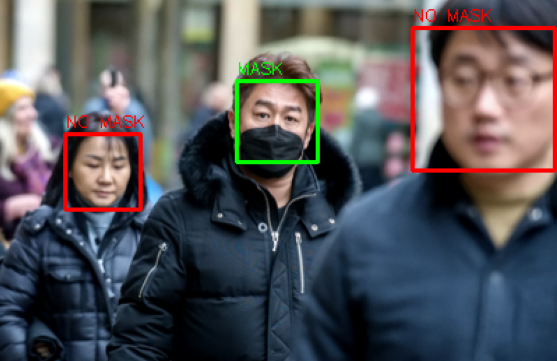
OpenCV identifies individual faces in an image, then feeds each cropped face into a Keras CNN built on ImageNet to classify whether the person is wearing a mask or not.

Dash & Plotly web app tracking US Covid-19 cases and R-rate estimates by county, sourced from Johns Hopkins data. Cleaned with Pandas, R-rate calculated via EpiEstim in R, and hosted on Google Cloud Platform.

An interactive family tree built as a standalone web page — visualising ancestry relationships with an expandable node graph, all rendered client-side with no backend.

Interactive personal finance dashboard tracking income, expenses, and savings with configurable categories and dynamic Chart.js charts — fully client-side, no backend.

This portfolio site — built with vanilla HTML, CSS, and JS on GitHub Pages. Features a procedural space canvas, scroll-reactive planet animation, hyperspace warp transitions, and a fully responsive project showcase.
Multiple ML models trained on 5,000+ UFC fights (1993-2019) to predict outcomes, then used to forecast the 5 main fights in UFC 259 with SKLearn, XGBoost, and Keras.
OLS regression with p-value-driven feature selection on world health data to identify the strongest statistical predictors of life expectancy.
Plotly/Dash dashboard on 44,000+ UK used cars scraped from Autotrader with BeautifulSoup, deployed on Heroku for interactive price exploration.
K-means clustering on London borough demographic data, combined with FourSquare venue data, to identify optimal business investment opportunities across the city.
Applies k-means, isolation forests, SVM, and LSTMs to NAB benchmark datasets, then tests supervised fraud detection techniques on a credit card dataset.
Two CNNs for mask detection — one trained from scratch, one leveraging InceptionResNetV2 transfer learning — demonstrating pre-trained model efficiency.
Interactive Plotly visuals from Federal Reserve data exploring the effects of the dot-com boom, 2008 crisis, and Covid-19 on US wages and employment.
Plotly visuals on Bay Area housing trends using Federal Reserve indices, with a Facebook Prophet forecast of future housing costs.
Plotly choropleth maps visualizing Covid-19 cases and deaths across US states and global countries over time since the start of the pandemic.
I am eager to help on any Data Science or Data Visualization projects I can. Please feel free to contact me via email or by phone. I am currently living in Framingham, Massachusetts but am willing to help no matter where you stay. Please search for me on Linkedin, GitHub, or even Kaggle and upvote my notebooks if you find them helpful or useful. Thank you!