Personal Budget Dashboard
What It Is
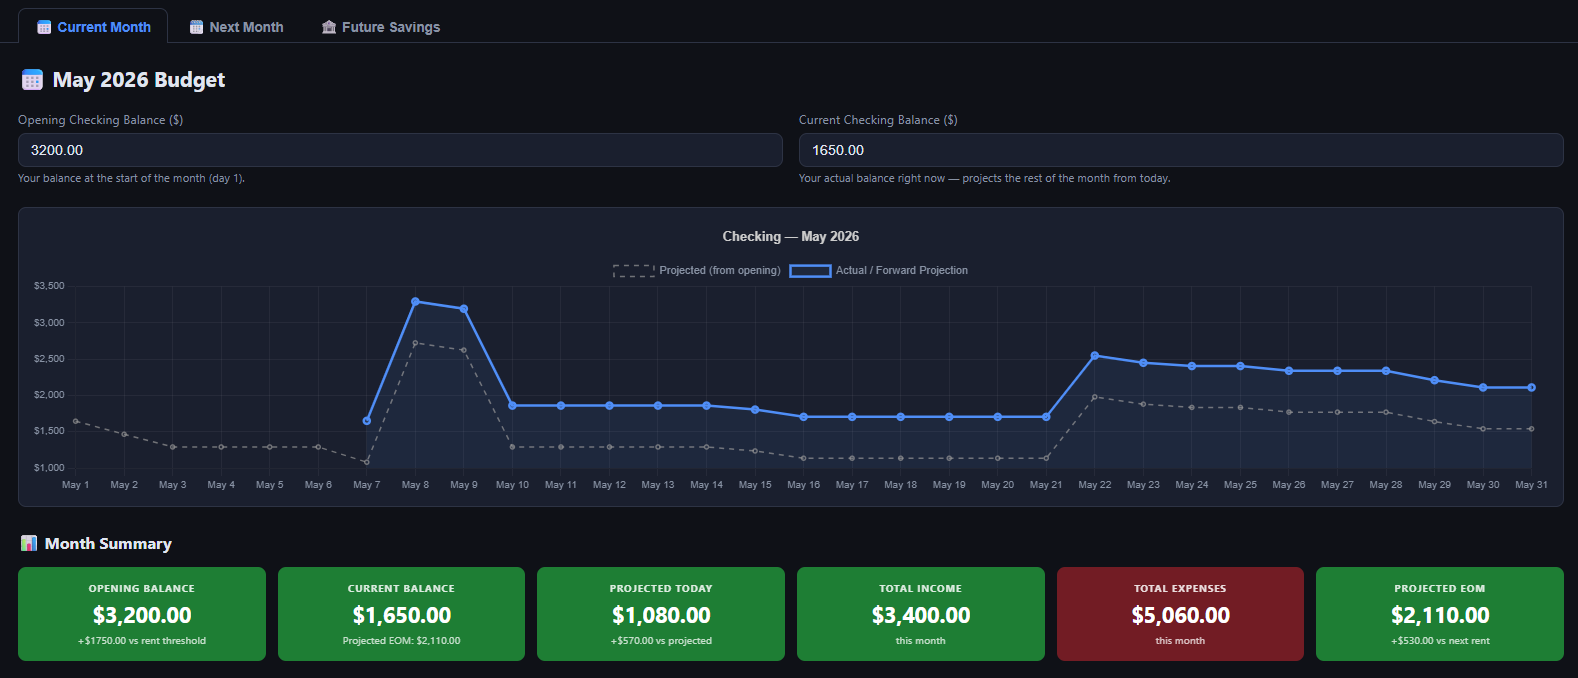
A proof-of-concept personal finance dashboard built entirely in vanilla JavaScript — no framework, no backend, no data leaving the browser. It visualises income, expenses, and savings across configurable categories using Chart.js, populated with US median figures as default demo data.
This is a web-native clone of a private tool I actually use: a Streamlit app connected to a Supabase backend that I use to balance expenses and track savings goals each month. That version sits behind a login and stays off my public portfolio for obvious reasons. This version exists to demonstrate the front-end and dashboard design work in a form anyone can open, explore, and plug their own numbers into — though without a backend, nothing persists across page refreshes.
Why I Built It
The motivation was straightforward: I wanted to replicate the front end of my Streamlit dashboard in a fully web-native framework I could host on GitHub Pages. Streamlit is excellent for rapid prototyping, but it requires a running Python server — not ideal for a static portfolio site. Rebuilding it in HTML, CSS, and JavaScript was a useful exercise in seeing how the same design translates across frameworks, and a chance to sharpen skills in building data-driven interfaces without any Python in the stack.
It is a POC and experiment more than anything else. The tool I rely on day-to-day is the Streamlit version. This one is here as a demonstration of capability — dashboard design, client-side data handling, and web-native visualisation.
Features
-
Overview
At-a-glance summary of total income, total expenses, and net savings for the selected period — updated dynamically as filters change.
-
Category Breakdown
Configurable spending categories with doughnut and bar chart visualisations — see exactly where money is going each month.
-
Trend Analysis
Line charts showing income and expense trends over time, making it easy to spot months where spending spikes or savings improve.
-
Demo Data
Pre-loaded with US median figures so the dashboard is immediately explorable. Numbers can be edited directly in the browser — though without a backend, changes won't survive a page refresh.